Archive for the ‘Statistics and numbers’ Category

Volvo introduces helmet to protect against Volvos

Wednesday, June 9th, 2010

Volvo XC90 Ocean Race

In News & Events on the Dutch Volvo website:

Bij Volvo staat veiligheid voorop. Niet alleen van de mensen in een Volvo, maar ook van iedereen eromheen. Daarom introduceren we nu de POCito: de Volvo onder de kinderfietshelmen.

Translation: At Volvo safety comes first. Not only for the people in a Volvo, but also of everyone around it. Therefore we now introduce the POCito: the Volvo amongst the children’s bike helmets.

Am I being simplistic in seeing this as essentially the same as Smith & Wesson introducing and promoting children’s bulletproof vests to protect them from the guns they make?
(more…)

Amsterdam: More Trips by Bike than by Car

Tuesday, June 23rd, 2009

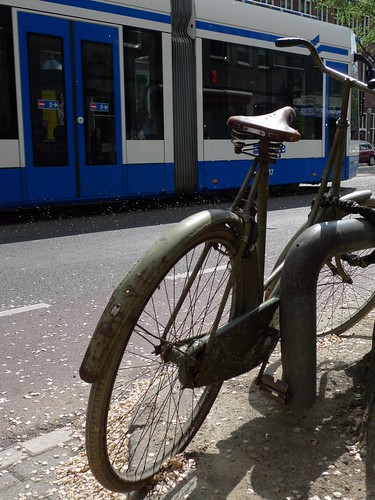
old green omafiets and tram

The question whether cycling is decreasing in popularity in Amsterdam or the Netherlands has been raised here several times. Each time the answer has been “No, transportation cycling is actually increasing here.” Today yet more statistics were listed in the Bike Europe trade website that show that bike use continues to rise.

from Bike Europe (via Fietsberaad though I couldn’t find it there) with my commentary mixed in:

AMSTERDAM, The Netherlands – The bicycle is the means of transport used most often in Amsterdam. Between 2005 and 2007 people in the city used their bikes on average 0.87 times a day, compared to 0.84 for their cars. This is the first time that bicycle use exceeds car use.

There are not many places in the world where bicycle use actually exceeds car use, and certainly no other capital cities. But it gets better…

In 2006 the inhabitants of Amsterdam engaged in some 2 million trips a day, an 8% reduction compared to 1990. This is due to the number of trips per person per day falling from 3.6 to 3.1. The number of transfers has fallen in the old city within the ring road in particular.

These seem to be the total numbers of trips, made by all means of transportation.

The number of trips by car, compared to 1990, has fallen in all districts (-14%), whereas the number of trips by bicycle has only risen within the ring road (+36%). The bike is used most often in the town centre (41% versus an average of 28%) and the car least often (10% versus an average of 28%). This can be attributed to the restrictive parking policies enacted here since the 1990s.

Not surprisingly the higher the density, the more bike use is favored. Thus where we live and the WorkCycles shops are the number of bicycle trips is at least four times as great as car trips.

‘Dienst Infrastructuur en Beheer’, the infrastructure department of the city registered approximately 235,000 car movements in both directions at the city centre in 1990; by 2006 this had fallen to 172,000, a decrease of over a quarter. Over the same period the number of daily movements by bicycle rose from 86,000 to over 140,000 (+60%).

Let’s keep up the good work so that in a generation cars will be an insignificant part of the traffic and street scene in Amsterdam.

Fresh cycling statistics from the Netherlands

Thursday, December 4th, 2008

These statistics about cycling just in from the Dutch RAI, “branch organization for mobility”

There are 19.1 million two-wheelers in the Netherlands (and 16.4 million people). This includes 634,000 motorcycles and about 500,000 mopeds and scooters, thus about 18,000,000 bicycles. Of course could pretty much guess this just by looking at the bicycle covered streets of each town. Its obvious there are about as many bikes as people, and they’re mostly city/utility bikes that live outdoors.

The number of motorcycles has doubled since 1998. Having (also) ridden a motorcycle for many years I can take some guesses about the significance of this: The motorcycle has steadily lost its bad-boy image, becoming more accepted and mainstream. As traffic and parking worsen the motorcycle (like the bicycle) becomes a suitable alternative to driving a car.

The Dutch rode rode their two-wheelers a total of 19 billion kilometers, about 3 billion more than in 1998. That’s approximately 1200 kilometers per resident of all ages, shapes and sizes per year. Considering the population too young or otherwise unable to cycle, that’s an awful lot of kilometers per person. One could argue that the inclusion of motorcycles skews the statistics, but then there are only 1/30th as many motorcycles as bicycles.

Elsewhere the bicycle usage stats are separated. Here we see that the Dutch cycle, on average, 909km per year, which translates to 2.48km per head, per day. This has largely held steady since 1991, the earliest year shown in the chart. Thus, a definitive NO to the question posed in an earlier post “Are the Dutch replacing their bikes with cars”.

Below some more statistics I find interesting

Sales of new bicycles in the Netherlands in 2007 by type (x1000):
846____City bicycle
227____Child’s bike
141____Hybrid / trekking bike
89_____Electric bike
48_____Mountain bike
33_____Folding bike
14_____Racing bike
50_____Others
3______Unknown
1401___TOTAL

Average purchase price for a bicycle in the Netherlands in 2007:
€603____All bicycles including department stores
€709____Sold through bicycle shops

Length of bicycle paths and roads per province:
872_____Groningen
997_____Friesland
1183____Drenthe
1401____Overijssel
549_____Flevoland
2182____Gelderland
947_____Utrecht
2307____Noord-Holland (Amsterdam region)
2198____Zuid-Holland (Rotterdam, the Hague region)
680_____Zeeland
2793____Noord-Brabant
962_____Limburg
17071___TOTAL

If 17,000 km of nearly perfect bicycle paths and roads doesn’t sound so impressive then just look at a map of the Netherlands to see how small this country is.

Source: RAI vereniging. Read it for yourself here. In Dutch of course.

UPDATE September 2009: A new and very thorough study of the Dutch bicycle path network was recently completed. It was determined that the earlier figure of 17,000km was highly inaccurate. In fact it was determined by actually measuring the roads with modern electronics that it is approximately 29,000km. But if that isn’t incredible enough consider that that is only a measurement of the bicycle paths separated from auto traffic. Painted bike lanes, as most of the world regards as “bicycle infrastructure” were not even counted. If they did they’d basically have to include the entire Dutch road network.


Bicycle death statistics in Amsterdam and the Netherlands

Thursday, October 16th, 2008

The question of how many people die each year as a result of bicycle accidents in Amsterdam and Holland in general comes up periodically. I’ve usually thrown out the figure of “a handful per year” that I’d once heard. It turns out that this is about right. Toby Sterling, fellow Amsterdam resident and blogger whom I’ve never met did the research and compares it nicely with other countries and the statistics for murders in Holland as well.

Here’s Toby Sterling’s blog and discussion of bicycle accident deaths.

And Toby’s earlier post here.

Here are some quick excerpts though Toby’s original text is more fun to read. Basically the message is simple: despite extremely high rates of cycling and negligible helmet use the odds of being killed while cycling in the Netherlands are extremely low.

  • Nationally the total of bicycle accident deaths hovers around 200.
  • In Amsterdam about 6 people die in bike-related accidents yearly.
  • 16 million Dutch own 18 million bikes.
  • About half the population of the NL rides a bike once a day.
  • The average distance traveled by bike per person per day was 2.5km in 2006.
  • The bicycle is used for almost a quarter of all journeys, and 35% of journeys below 7.5km.
  • Overall traffic safety in NL is the best in Europe with 45 deaths per million inhabitants per year.
  • The US has 147 deaths per million inhabitants per year.
  • You’re more likely to die of murder in the US than by cycling in the Netherlands.
  • You’re more likely to die by drowning in the Netherlands than by cycling.
  • How safe is your city? Put it to the “bicycle test”.

    Friday, October 10th, 2008

    Rick Pepper of 11 Gear sent me this interesting barometer of how safe a city is. Using hidden cameras and cheap bicycles as bait, Mariano Pasik gauges crime in different neighborhoods of Buenos Aires. His hypothesis: the longer it takes for the bike to be stolen the safer the area is. Pasik now invites others to do the same in their cities to create a worldwide insecurity index.

    Whether or not the bicycle test safety scale is adopted on a wider basis, Pasik’s films are entertaining in a sort of “real-world reality show” way. Eventual thieves pass the bikes numerous times, scoping them out, looking for locks or owners. Its pretty clear from the videos that the thieves are not professionals. Most just seem like opportunists rather than hardened criminals. Pasik suggests that they’re deliberating on the act, in a sort of internal conflict between good and bad.

    Have a look at lapruebadelabicicleta